
WIPO: World Intellectual Property Indicators – 2014
January 07, 2015
Categories:
Beitragsdatum:
7. Januar 2015 - 14:41
The World Intellectual Property Organization (WIPO), a specialized agency of the United Nations headquartered in Geneva, Switzerland, has just published the Global Innovation Index (GII) Report. The report provides a wide range of indicators covering the following areas of intellectual property: patents, utility models, trademarks, industrial designs, microorganisms and plant variety protection.
Trademarks
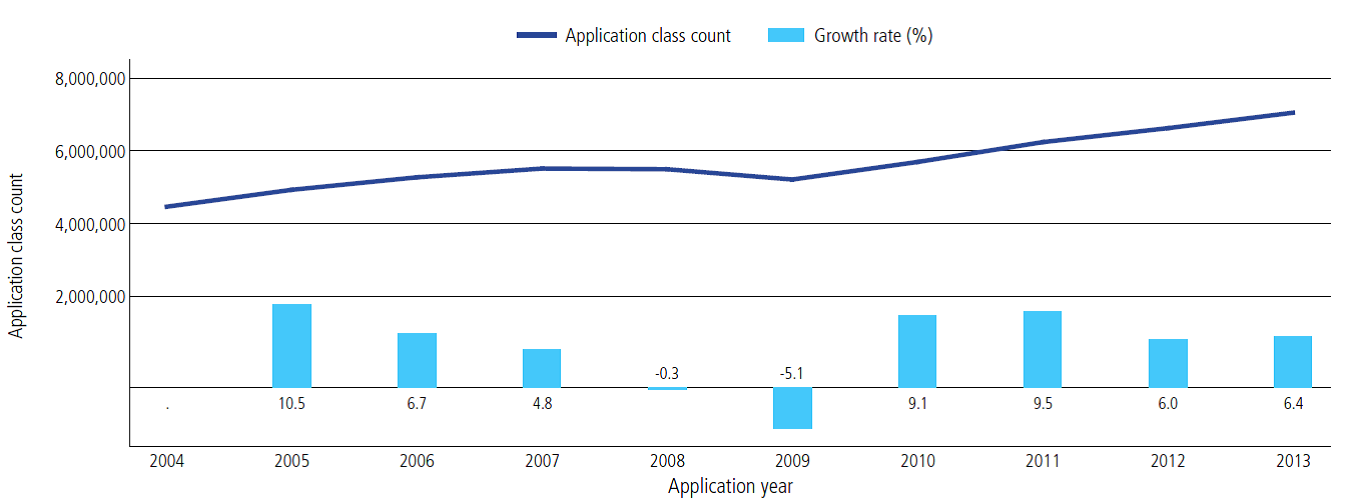
As you can see from the figures below, the total number of classes specified in applications for the first time surpassed the seven million.
The ranking of the top 20 Trademark Offices was similar to that in 2012. China had the highest trademarking activity with 1.88 million class counts, followed by the United States with 486,128 million class counts and Europe (OHIM) with 324,749 million class counts. Only the Russian Federation edged in front of Turkey and therefore, enters into the top five. In addition, the Republic of Korea and India surpassed Germany.
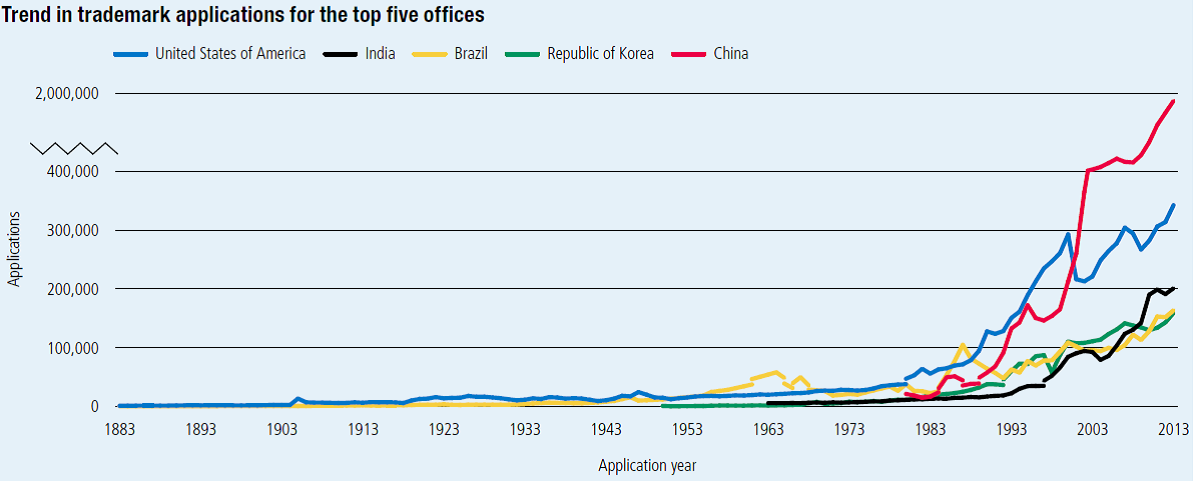
As you can see below, trademark filings were equally low and stable until the mid-1980s. Chinese filings took off in the 1990s. Filings in the US have doubled since 1995 despite the decline at the end of the dot-com era in 2001 and 2002 and the financial crisis in 2008 and 2009.
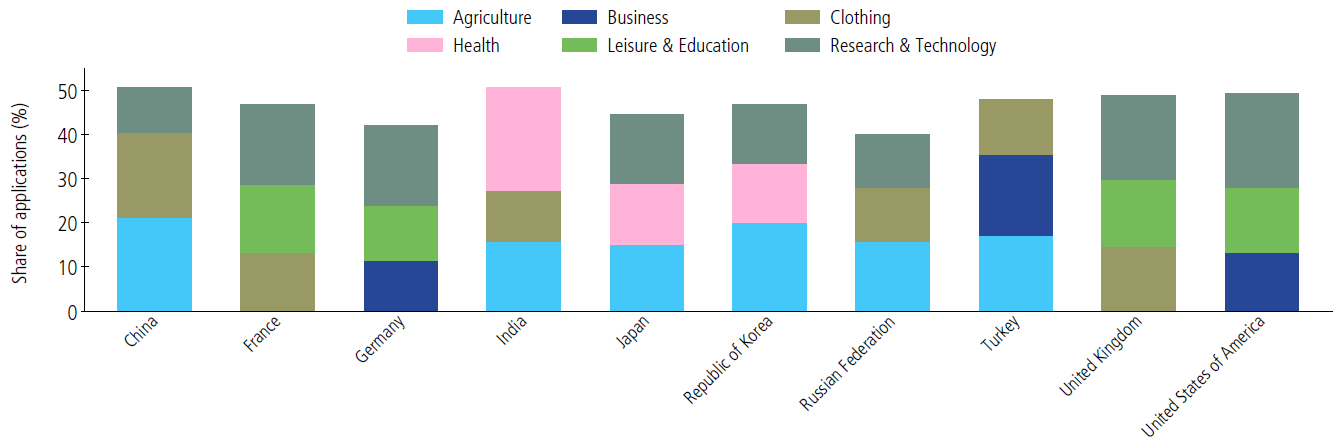
Below you can see the trademark applications by sector (Top Three Sectors) and origin. Trademarks relating to the service class that is associated with business management and administration have continued to the top. They are followed by the goods class that cover clothing and the research and technology class relating, among others, to scientific, photographic and computers.
Patents
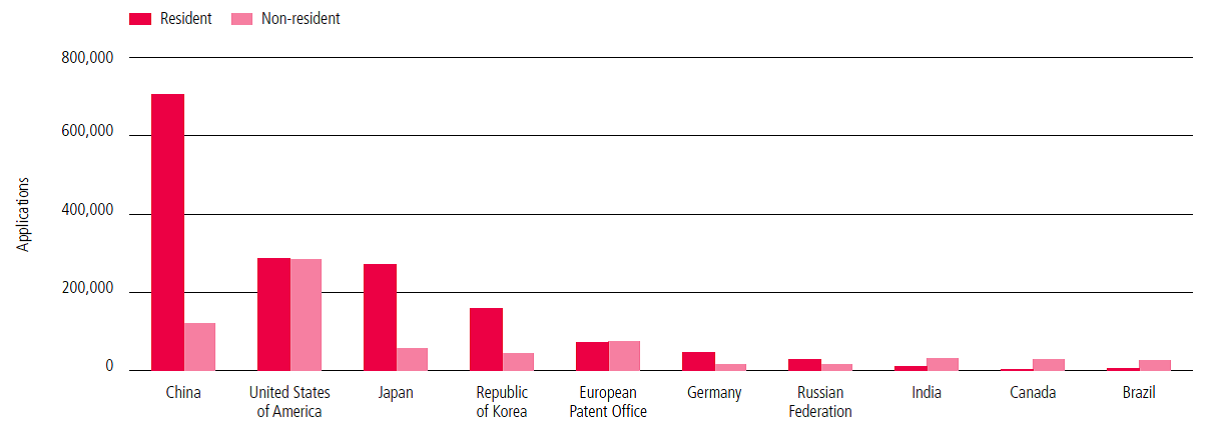
In total, innovators filed 2.57 million patent applications worldwide in 2013. This is a 9% increase in comparison to 2012. The global total consists of 1.71 million resident filings and 0.86 million non-resident filings. China (32.1% of world total) and the US (22.3% of world total) received more than half of the global filings, while the European Patent Office (EPO) has to recognize that, its share of the world total felt to 5.8%.
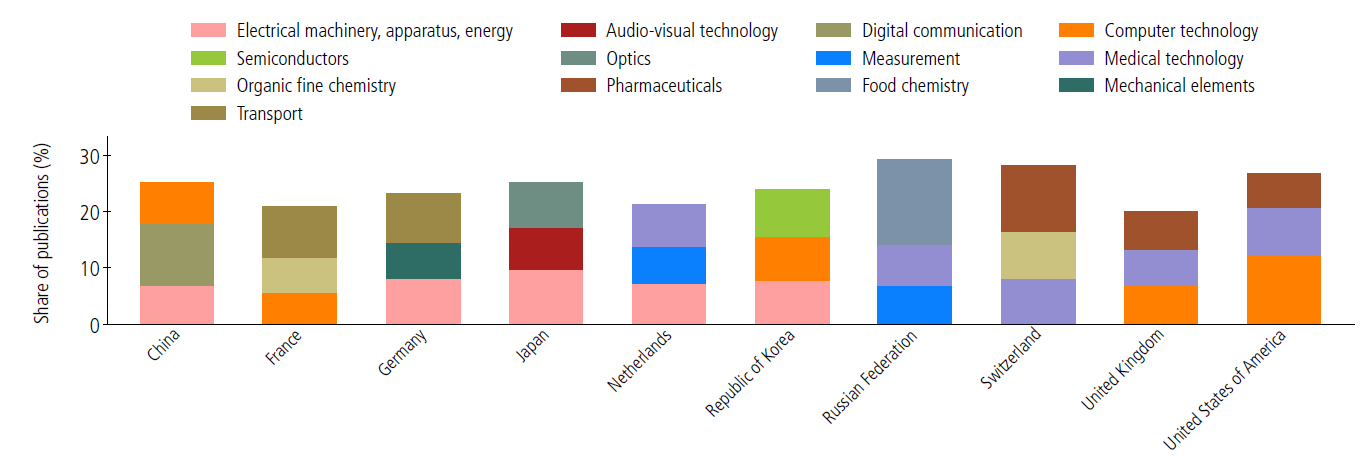
Below you can see the top three technology fields for the top ten origins. In total, computer technology (7.6% of total) are the most published applications worldwide, followed by electrical machinery (7.2% of total), measurement (4.7% of total), digital communication (4.5% of total) and medical technology (4.3% of total).
Below you can see the patent applications at the Top10 offices in 2013. As the figure shows, China’s State Intellectual Property Office (SIPO) maintained its position as Top Patent Office in the world with 825,136 filings, followed by the United States with 571,612 filings and Japan by 328,436 filings. The European Patent Office (EPO) received fewer applications in 2013 than in 2012.
For more detailed information and the full report including charts, overviews and other statistics please see: http://www.wipo.int/edocs/pubdocs/en/wipo_pub_941_2014.pdf
Related
- "Neuschwanstein" is not a trademark!
- 14 June 2013: Munich Patent Law Conference - Calculating Damages in Patent Infringement Cases
- 15 Top Brands - Interactive Brand Rating - Years 2000 - 2018
- 2014: Statistics for Community Trademarks
- 27 June 2014: Munich Patent Law Conference – Burden of Pleading and Proof in Patent Infringement Cases
- 3D-Trademark Protection for layout of Apple Stores
- 40th Anniversary of the European Patent Convention (EPC)
- A backpack shape as a 3D trademark – a BoA decision of the EUIPO
- A case of „Bounty“ hunting in Germany
- A new report on the economic impact of counterfeit trade published by OECD and EUIPO