
WIPO 2016: A year in life
On 15 March 2017, WIPO published a press release, showing their 2016 in numbers. And there was a lot to celebrate, as 2016 marked a record-breaking number of patent, trademark and design applications, and a significant growth on all three fronts for the seventh year in a row.
On the gloomier note, the number of cybersquatting disputes under the Uniform Domain Name Dispute Resolution Policy (UDRP) broke a record as well, with its 10% rise in comparisom to the number in 2015.
Trademarks
In 2016, 52 550 trademark applications were filed, with 347 544 designations to Madrid Treaty signatory countries (most of which to China (22 314 designations), the European Union (21 526) and the US (20 979)). The US and Germany are the predominant applicants, both with over 7500 applications. The rest of the top five are France, China and Switzerland.
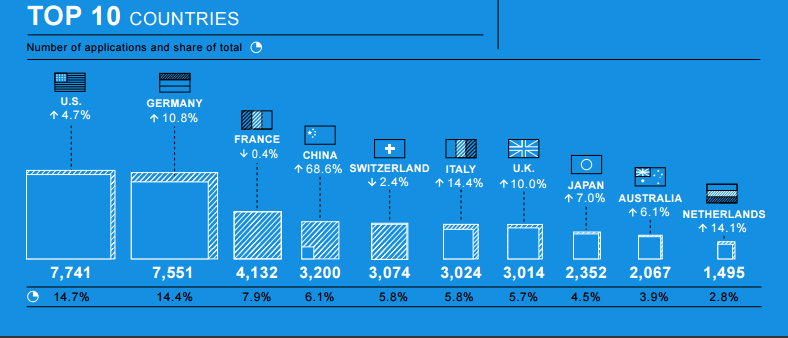
China was the surprise of the day, with its 68.6% growth in comparison to 2015. Also, Russian Federation (+32.7%), Italy (+14.4%) and the Netherlands (+14.1%) had enviable increases in the numbers of applications.
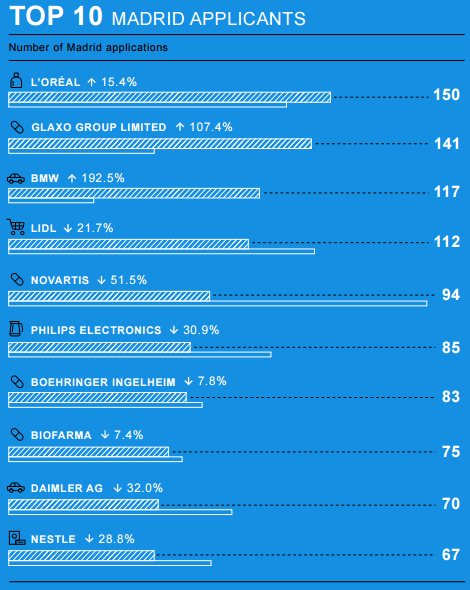
When talking about individual applicants, the top five places go to European companies. French L’Oréal took the lead with its 150 TMAs, closely followed by British Glaxo Group (141), German BMW and Lidl, and Swiss Novartis.
Despite to what may be deduced from the top applicants´ industries, most applications were for the classes covering computers and electronics, services for business and technological services, leisure and educational services and clothing.
Industrial designs
While patents and trademarks showed a similar growth rate, the same cannot be said about designs. In the previous year, 5562 applications were filed, containing 18 716 designs, which means a 35.3% increase.
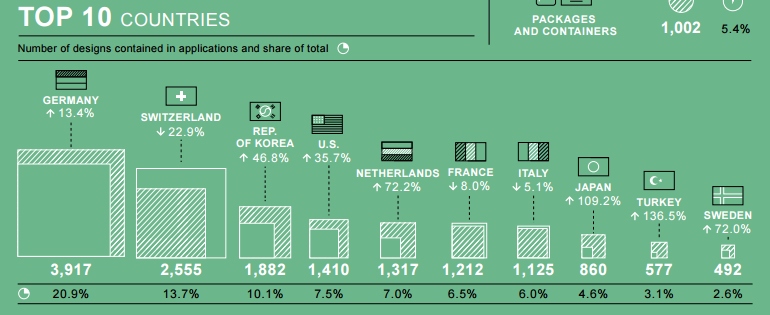
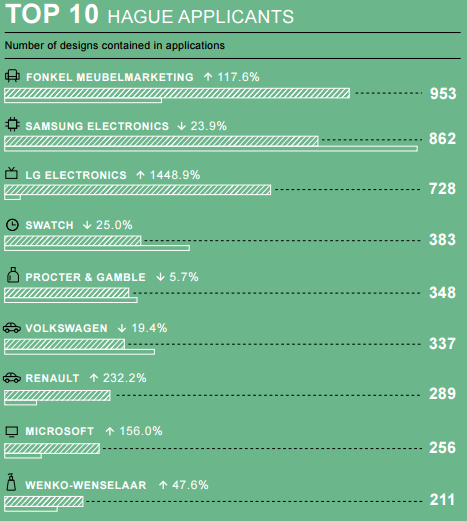
Most applications come from Germany (3917) and Switzerland (2555). The third place belongs to South Korea, whose Samsung was the last year´s biggest applicant company. However, this year, they were surpassed by Dutch Fonkel Meubelmarketing, with their 953 designs, compared to Samsung´s 862. They are followed by another Korean technology giant, LG Electronics, and their 728 applications.
Unsurprisingly, most design applications cover furnishing (11.3%), communication equipment (10%), vehicles (7.8%) and watches (6.9%).
An interesting thing to see are the biggest improvers. The story here is not equal to China´s boost in TM and patent registrations. At the first glance, Turkey´s 136.5% and Japans 109.2% growths seem far better. However, their starting points were not the same. Turkey and Japan were not at a position to boast about their design protection. Therefore, their numbers should be considered as an excellent start to an elevated registration system.
Patents
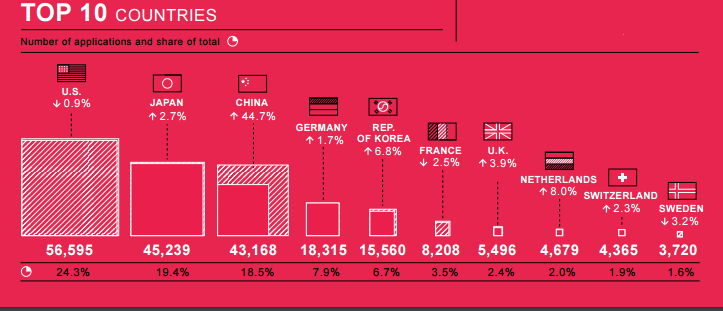
Patents filed under the Patent Cooperation Treaty (PCT) show a 7.3% increase from 2015, amounting to 233 000. Predictably, most of them come from digital communication and computer technology companies. Also, the ranking of the countries has remained the same, with the US at the helm, followed by Japan, China and Germany.
However, here is where the biggest surprise comes in. China has marked a staggering 44.7% surge in the number of patent applications. If they continue growing at this rate, within the next two years it can be expected for them to take the reign from the US (which has been in the lead for the past 39 years). Other countries showing significant rise are Italy, Israel and India, all showing approx. 9.5% more international applications.
A lot of the credits for China´s success go to the telecommunications magnates ZTE Corporation and Huawei Technologies, who top the list of the applicants. They are followed by American Qualcomm Inc., Japanese Mitsubishi Electric Group and Korean LG Electronics.
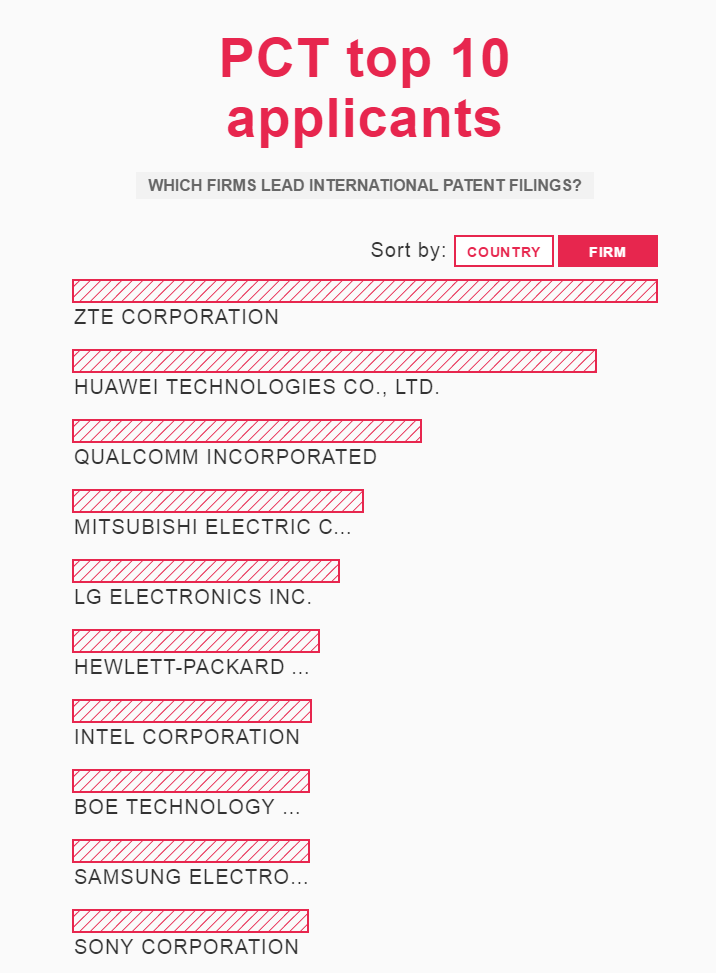
Among educational institutions, there is an equal division of places between Asian and American universities in the top 20. However, the top 10 is predominantly American, with University of California, MIT, Harvard, Johns Hopkins and Texas System taking the top positions.
Cybersquatting disputes
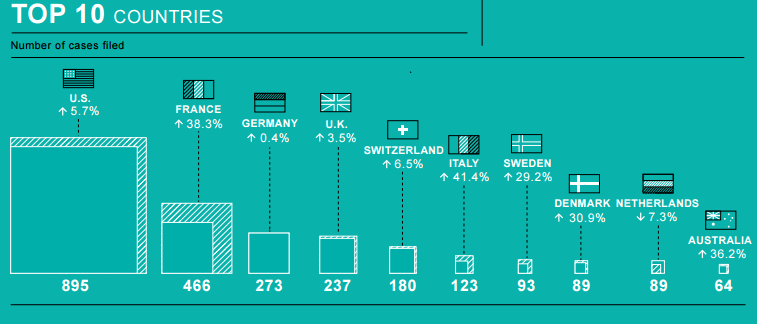
With the introduction of 1200 new generic top-level domains (gTLDs), business owners received an opportunity to tailor their websites according to their needs, marketing strategies and wishes. However, the side effect of such freedom is a flourishing market for cybersquatters. In 2016, 3036 cases were brought to WIPO, regarding 5374 domain names. Sometimes, the cases involved a country code Top-Level Domain (ccTLD), but a lot more frequently, it was about the new gTLDs (usually .XYZ, .TOP and .CLUB).
According to WIPO´s statistics, most disputes came from the US, almost twice more than the second-placed France, and three times more than the third-placed Germany. Equally alarming are the numbers showing the upsurge of cases, which in France’s case amounts to a high 38%, Australia´s 36%, and Denmark´s and Sweden´s around 30%.
12% of cases evolved around banking and finance, followed by fashion, heavy industry and machinery, Internet and IT and biotechnology and pharmaceuticals, whose numbers vary from 7-9% of all disputes.
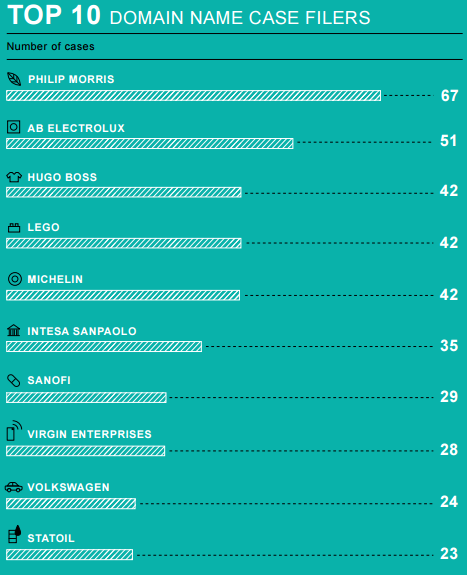
American tobacco company Philip Morris can call themselves 2016´s most diligent anti-cybersquatter, with 67 cases brought to WIPO, along with AB Electrolux (51 cases) and Hugo Boss, LEGO, and Michelin (42 disputes each).
Intellectual Property disputes
Solving domain name issues is only a part of WIPO´s attempts to actively resolve IP-related disputes. Another part is the WIPO Arbitration and Mediation Center, aimed at offering Alternative Dispute Resolutions (ADR) options to private parties caught in an international commercial dispute. In 2016, the most favored option was mediation, followed by arbitration and the shorter expedited arbitration.
What characterized the cases was their diversity. Out of the 60 cases WIPO received, the parties involved companies, both large and SMEs, as well as private persons, NGOs, municipalities, etc., deriving from 19 countries. 34% were patent-, 20.5% Information and Communication Technology-, 13.6% copyright-, 13.6% trademark-related, while the other 18% was dispersed between distribution and franchising agreements, design and cultural heritage protection.